A perfect hammer forms at support. You enter long, feeling confident. Then, two candles later, price slices straight through the low. If that sounds familiar, you are not alone. Most traders meet this problem early, and many never solve it.
The issue is rarely the pattern itself. Instead, the issue is context. Candlestick patterns describe a short battle between buyers and sellers. However, that battle always happens inside a bigger war. When you read a single chart in isolation, you only see one small fight.
After two decades of watching charts across stocks, forex, and crypto, one lesson stands out. Candlestick patterns become far more reliable when they agree across timeframes. In this guide, you will learn why signals fail, how multiple timeframe analysis works, and a practical routine to filter out noise.
Every candle is a summary. A daily candle compresses 24 hours of trading into four prices. Similarly, a 15-minute candle compresses only a sliver of that day. As a result, each timeframe tells a slightly different story.
False signals usually come from three sources.
Lower timeframes are full of small pullbacks. For example, a bullish engulfing candle on a 5-minute chart may simply be a pause inside a strong daily downtrend. The pattern is real, yet its power is tiny compared to the larger trend.
A pattern means little in the middle of nowhere. A shooting star near a major resistance level carries weight. In contrast, the same candle floating between levels is often just random movement.
Some candles form during thin trading hours. Because fewer orders are placed, prices can be pushed around easily. Consequently, patterns formed in quiet sessions tend to fail more often.
In short, a candle without context is a guess. Therefore, the goal is to add context, and higher timeframes provide it best.
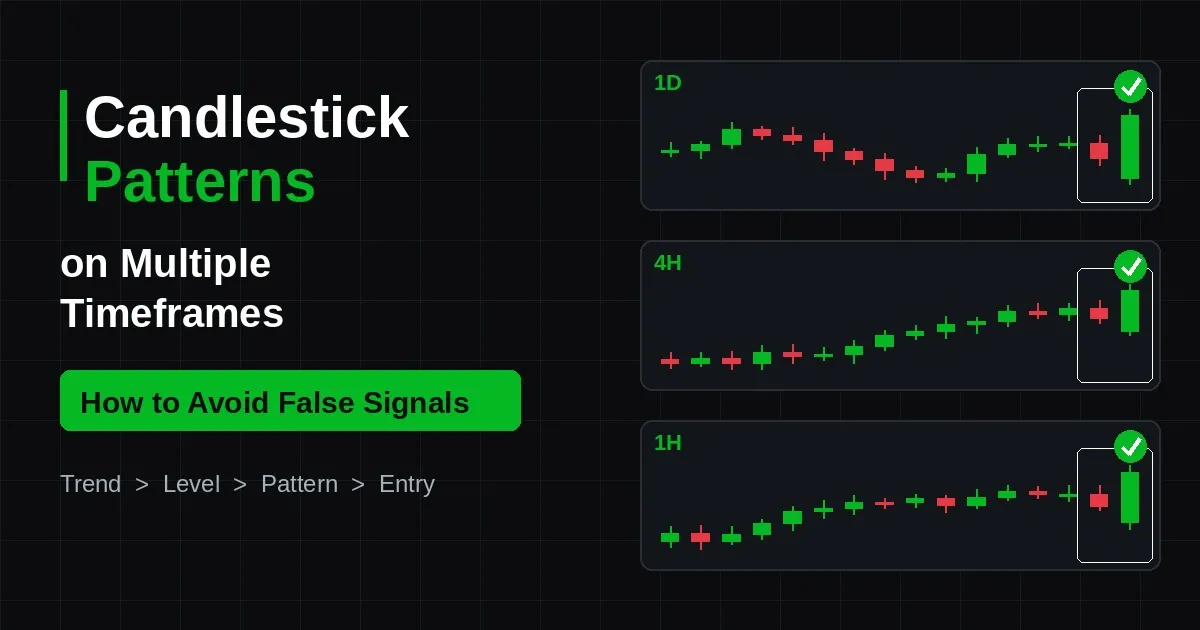
Multiple timeframe analysis means reading the same market on two or three charts. Each chart has a specific job. Think of it like using a map, then a street sign, then your own eyes at the crossing.
A common rule is to space each timeframe by a factor of four to six. For instance, a swing trader might use the weekly, daily, and 4-hour charts. Meanwhile, a day trader might use the 1-hour, 15-minute, and 5-minute charts. This spacing keeps the charts different enough to add value. At the same time, they stay close enough to relate to each other.
When all three charts point the same way, the odds shift in your favour. A bullish pin bar on the 4-hour chart is useful on its own. However, it becomes much stronger when the daily trend is up and price sits on daily support. In that case, the smaller pattern is supported by the bigger picture.
On the other hand, conflict between timeframes is a warning. If the daily chart is bearish and your setup chart prints a bullish pattern, caution is needed. Often, the better choice is simply to wait.
The following routine is simple, yet it removes a large share of false signals. Follow it in order, and do not skip steps.
Start with the biggest chart you plan to use. Look for higher highs and higher lows in an uptrend, or lower highs and lower lows in a downtrend. A 50-period moving average can also help. If price stays above a rising average, the bias is bullish. If it stays below a falling one, the bias is bearish.
Next, draw the major support and resistance zones from the higher timeframe. These are areas where price has turned several times before. Zones work better than thin lines, because markets rarely respect an exact price.
This step requires patience. Instead of hunting for patterns everywhere, wait until price arrives at one of your marked zones. Only then should the middle timeframe be studied for candlestick patterns.
Now, look for a clear reversal or continuation pattern. Check that the pattern points in the same direction as the higher timeframe trend. Also, check the size of the candle. A tiny engulfing candle shows weak conviction. A large one shows strong commitment.
After that, look for supporting evidence. Rising volume on the signal candle is a good sign. Likewise, a bullish divergence on the RSI can back up a bullish pattern. Confirmation does not need to be complex. It simply needs to agree with the candle.
Finally, drop to the lower chart. Wait for a small break of structure in your direction. For example, after a daily hammer, a 1-hour chart might print its first higher high. That break gives you a cleaner entry and a smaller stop.
Place your stop beyond the pattern's extreme. Then, set a target at the next higher timeframe level. If the reward is not at least twice the risk, the trade is usually skipped.
Not every pattern behaves the same way on every chart. Below are the bullish and bearish candlestick patterns that tend to hold up best when checked across timeframes.
Imagine EUR/USD in a clear daily downtrend. Price rallies back into a former support zone, which now acts as resistance. On the 4-hour chart, a bearish engulfing candle forms right at that zone. Then, on the 1-hour chart, price breaks its most recent higher low.
In this case, all three timeframes agree. The trend is down, the location is right, and the trigger is clear. That is the kind of setup where bullish and bearish candlestick patterns earn their reputation.
Now consider the opposite. Suppose a bullish hammer appears on the 15-minute chart in that same downtrend. Although the candle looks textbook, it fights the daily trend. As a result, it is far more likely to fail.
Learning candlestick patterns for beginners is mostly about unlearning bad habits. Here are the mistakes that cost new traders the most.
A hammer can turn into a bearish candle in the final minutes. So, always wait for the close. An unfinished candle is not a pattern yet.
Checking six charts creates confusion, not clarity. In most cases, three timeframes are enough. Two can work well, too.
This is the most common error. A lower timeframe signal against the higher trend is usually a trap. Therefore, make the higher chart your first stop, every time.
There are dozens of named patterns. Yet the logic behind them is simple. Long wicks show rejection. Big bodies show control. Small bodies show indecision. Once you understand this, the names matter far less.
Record every trade with a screenshot of each timeframe. Over time, you will see which setups work for you and which do not. A journal turns guesses into data.
For anyone studying candlestick patterns for beginners, one more tip helps. Practise on historical charts first. Scroll back, hide the future, and test your routine without risking money.
Candlestick patterns are not magic, but they are honest. They show who won a short battle between buyers and sellers. The problem starts when that short battle is mistaken for the whole war. By checking the higher timeframe trend, waiting for key levels, and timing entries on a lower chart, most false signals can be filtered out before they cost you.
To sum up, keep your routine simple. Use three timeframes at most. Trade with the dominant trend. Wait for the candle to close. And above all, let location and confirmation do the heavy lifting. With steady practice, reading candlestick patterns across timeframes becomes second nature.
Many traders also lean on tools that scan several timeframes at once and highlight where signals line up. If you are researching such tools, a common question is "is GainzAlgo legit?" The fair way to answer it for any indicator, GainzAlgo included, is to test it on a demo account, compare its signals against the multi-timeframe checklist above, and judge it by your own journal rather than by marketing claims.